Doing things in R
The R software environment for statistical computing and graphics is AWESOME.
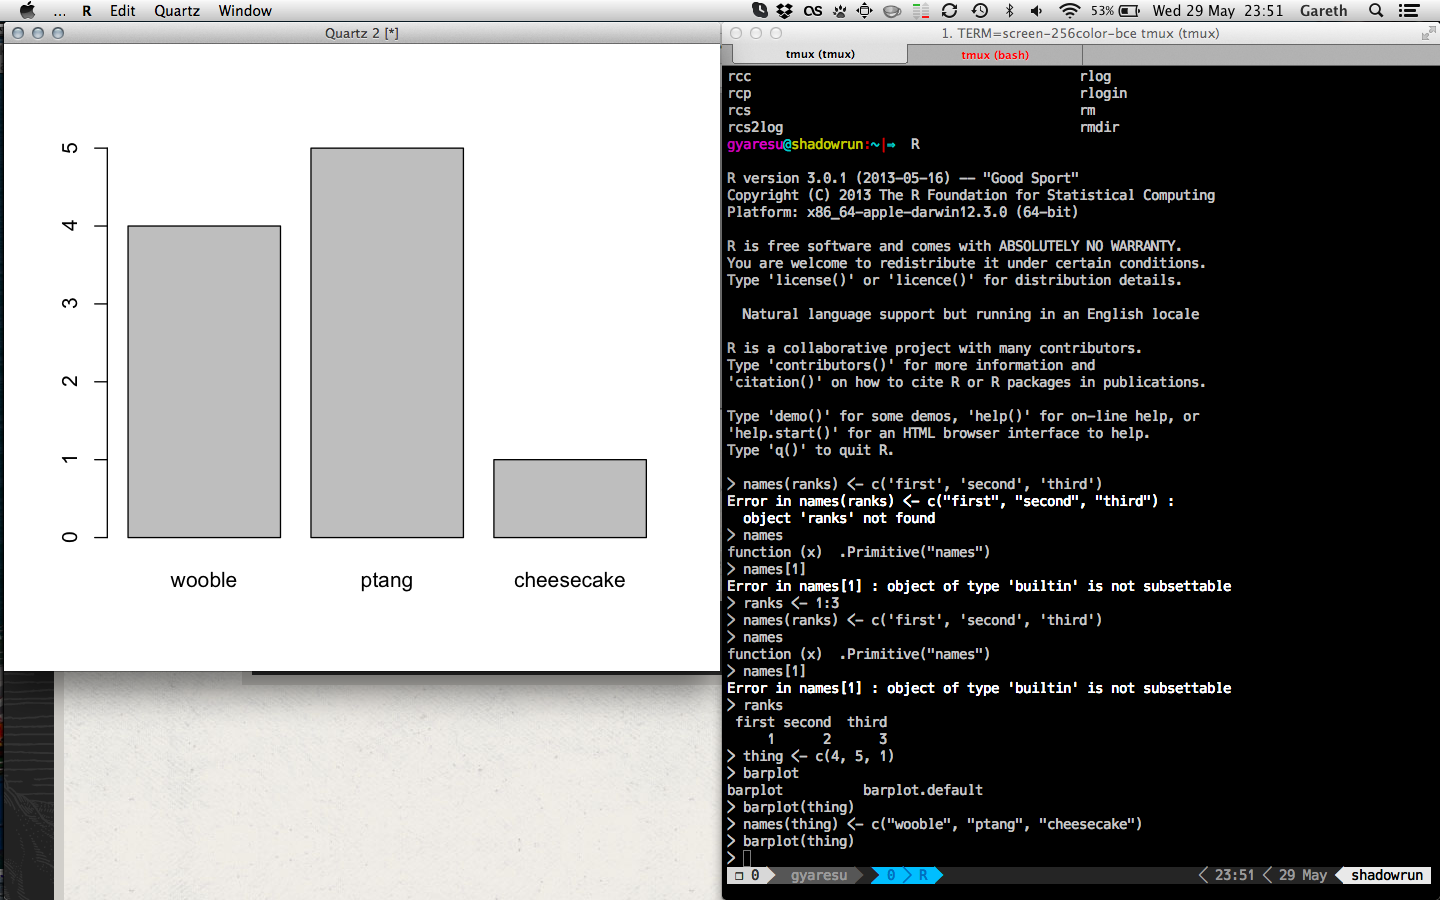
There’s just nothing quite like the feeling of writing code in a new environment and having a freaking chart just magically pop up on your screen. Wheeeeeeeeee!
Much more to follow me thinks. So many applications to play with interesting data.